
Training
Guest post: Training is more than just averages
I am often asked what the most important aspects of performance data are for MTB racing and training.
My answer is always, “all of it.”
Back in the day we only had heart rate. Now we have heart rate plus power meters. And I’m sure one day we will have more.
We are in a good place now though, even with just a power meter and a heart rate monitor synced with GPS. Fortunately, this is becoming standard now as everyone realizes now how much we’ve been guessing!
Performance analysis is easy
It is my opinion that race performance analysis is easy. Usually, the athlete and the coach know a lot about the trail, what the athlete is able to do when going hard based on the racecourse profile, how fit the athlete is at the time of the race, what the athlete can/should do lap-by-lap, etc.
Similarly, analyzing an easy road ride is easy. For the most part – on a flat or rolling road – it is pretty easy to stay within a power and heart rate zone. It’s super straightforward—power and heart rate should be what you expect.
On the other hand, analyzing an ‘easy’ MTB ride is a little more difficult. If done properly, an easy ride is done very often within a training session. This means that there is a greater chance of highly varied ‘easy’ training files to sift through. The trails might be different, the feeling of the rider may be different, and durations may affect measurements, etc. This also means that there is a pretty big difference between our average or overall measurements of power output and heart rate.
While ‘easy’ is subjective, we usually have pre-set training zones to make sure that a rider knows what to do in a ride, and so that coach can check over this to see if anything in training needs changing.
It’s possible to browse through completed training very quickly without looking at every spec of data every time, but below are some examples of when it’s worth digging a little bit deeper on a training ride.
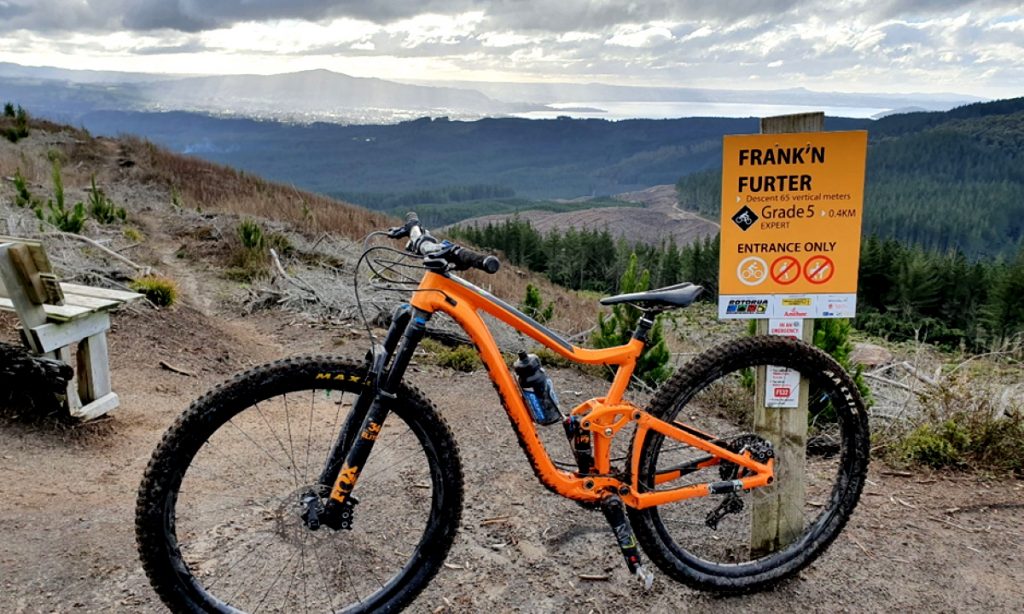
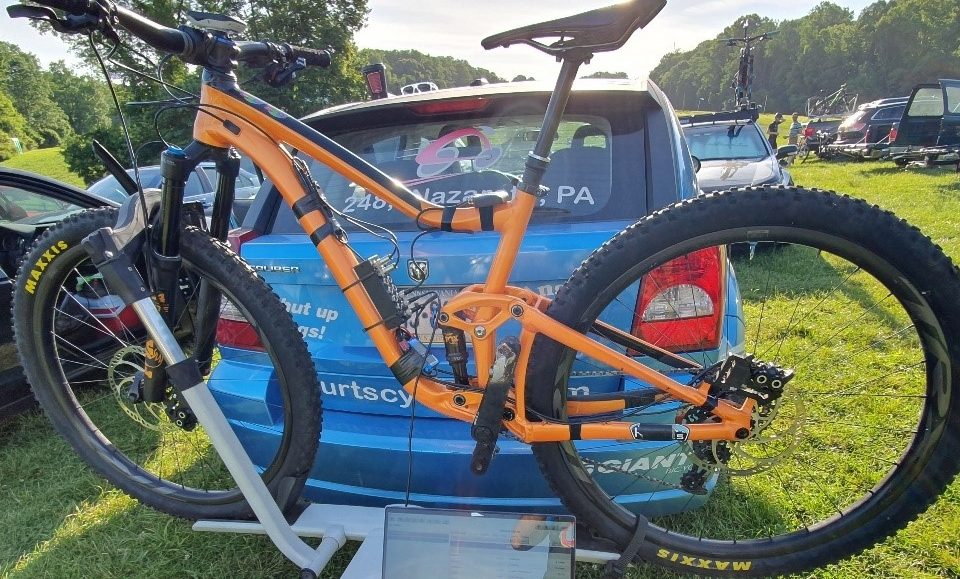
It’s easy to stay in your training zone in Rotorua thanks to all the gravel road and the great views!
Two rides – Are they the same?
At first glance, the two rides below look pretty similar. Given all the coasting on trails, the average power looks pretty good, and normalized power looks pretty good, too (at least in the right zone). Average heart rate even looks good. TSS scores were also not that different.
So to a coach or athlete quickly browsing through, the easy ride looks pretty easy, which is good!
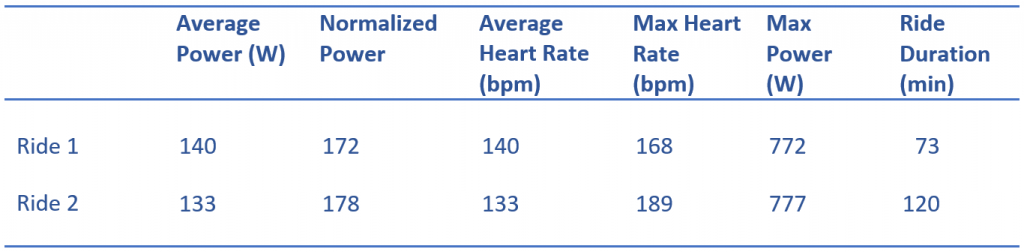
But the real ringer for me as a coach is the max heart rate! On Ride 2 it was really high! And even a bit high on Ride 1…
This is when I look a little bit deeper.
Were you in your training zone?
Thanks to all the many years of scientific research, we know that a certain intensity places certain demands on the body. Thanks to heaps and heaps of data, everyone’s results were compiled and these fancy intensity ‘zones’ popped out. The whole reason power and heart rate zones exist is because we believe that exercising at a certain level of intensity will bring about certain adaptations.
In cycling or MTB, there are many adaptations we may want, so we often have hard rides with short efforts and long rides at an easy effort all in the same week. As a coach, I manipulate the timing and intensity of these different rides in an attempt to control when a rider’s best performance will occur.
By this point, I have noticed that the rider’s max heart rate got quite high on Ride 2 (despite relatively good overall measurements), so I’ve opened up the file to look a bit more.
Looking closer at the rides
Apart from massive power spikes due to a poorly timed sprint, or single times when the heart rate was much higher than the others, I usually zoom in on a major climb.
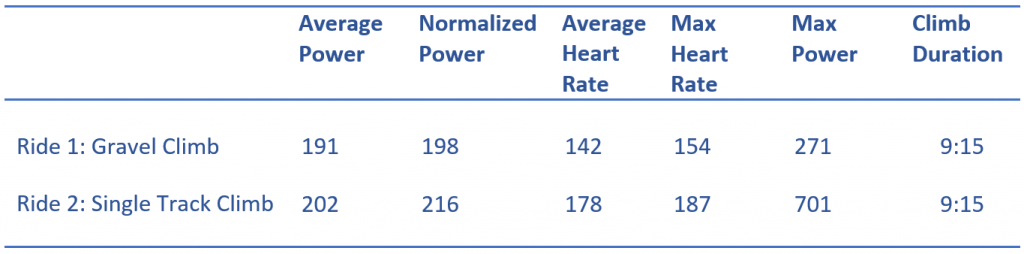
Below are the stats from a climb in each ride. These climbs were the same duration but on different terrain.
You can clearly see differences in max power in the overall results, as well as big differences in heart rate between the two climbs. This all despite average and normalized power is pretty similar!
And this is when I look closer again.
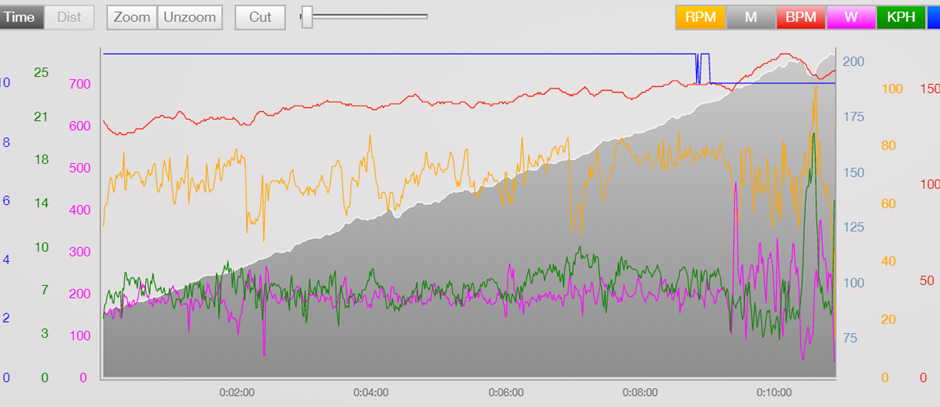
Here are screengrabs of the two climbs. First the gravel climb in ride 1:
And the singletrack climb from ride 2:
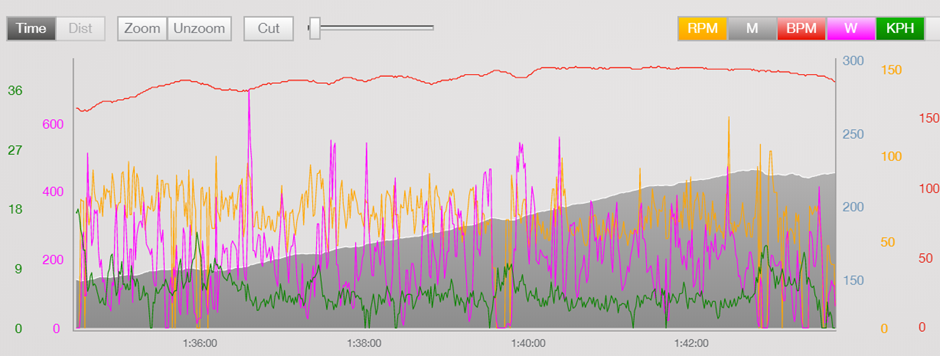
The big issue for me here is all of the spikes above the average power on the singletrack climb on Ride 2. This tells me that the intensity of this climb was not eliciting the training stress expected from an ‘easy’ ride. If the average power on this climb was something ~200 W, there are more than 20 spikes in power at least double that!
Indeed, this climb – and thus the ride—were not easy at all. There were simply too many spikes in power above an endurance zone and above the threshold to consider this an easy ride.
And in this case, neither average or normalized power was very helpful in determining the intensity of this ride.
All those spikes in power had elevated the heart rate beyond the zone, which led to a higher than expected average heart rate, and this ride was clearly not as ‘easy’ as it first seemed.
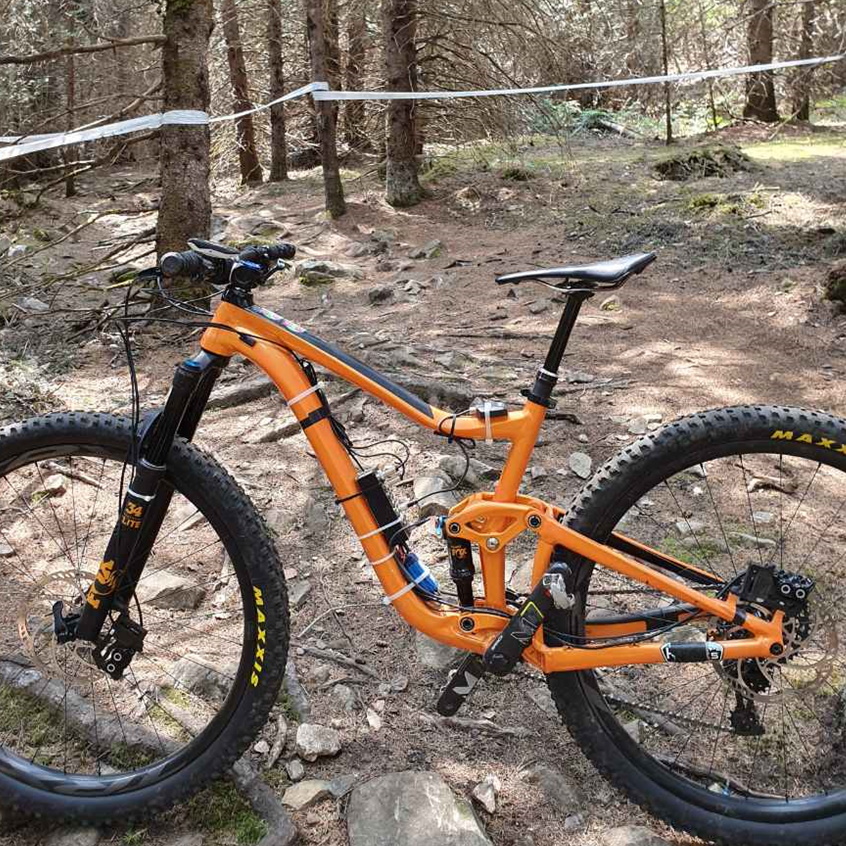
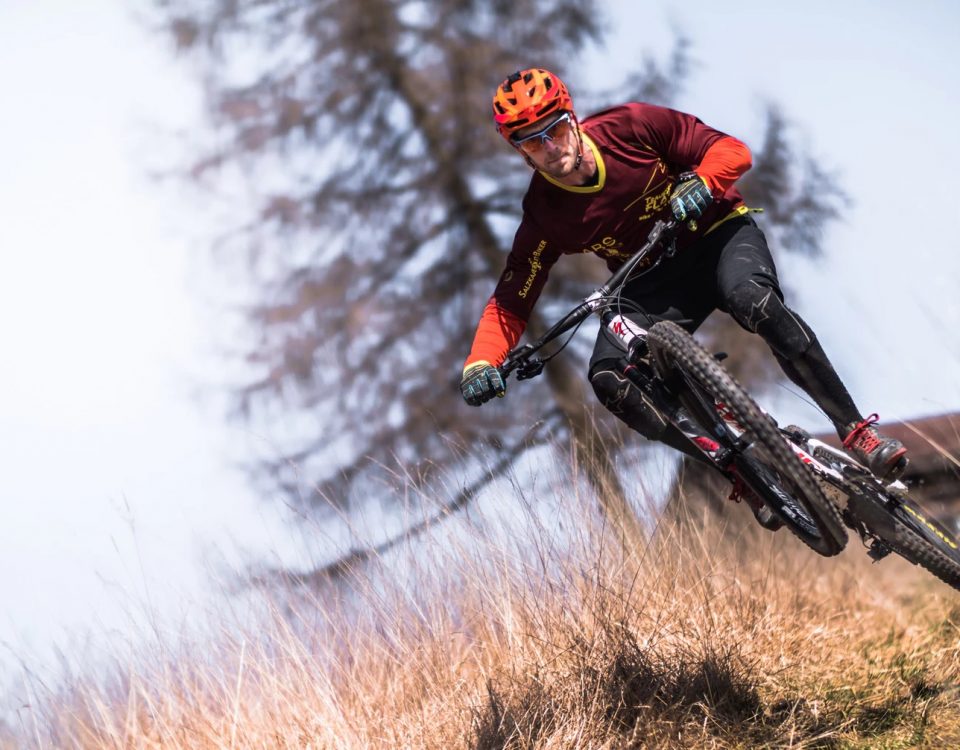
It is pretty tough to ride these trails easy!
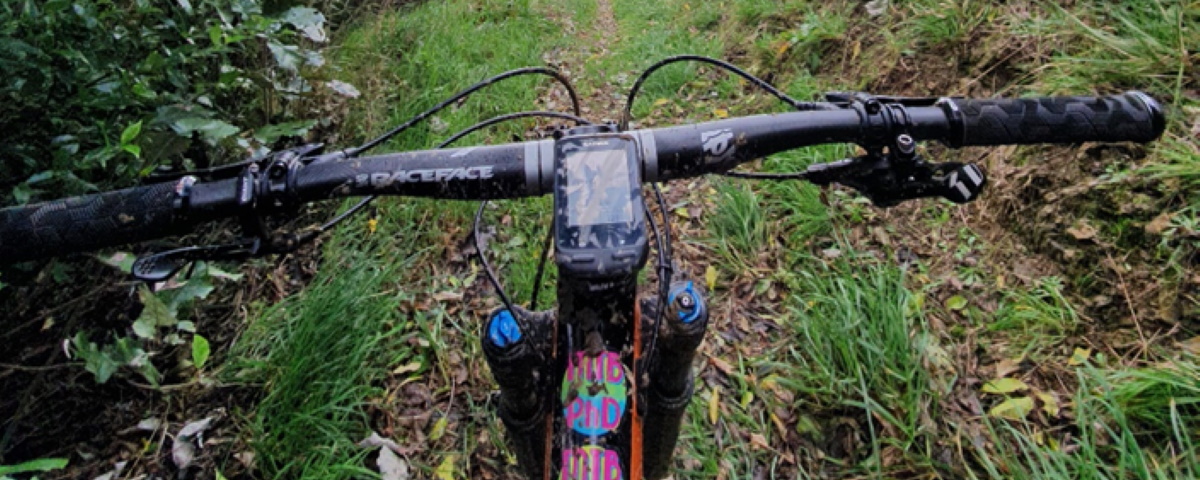
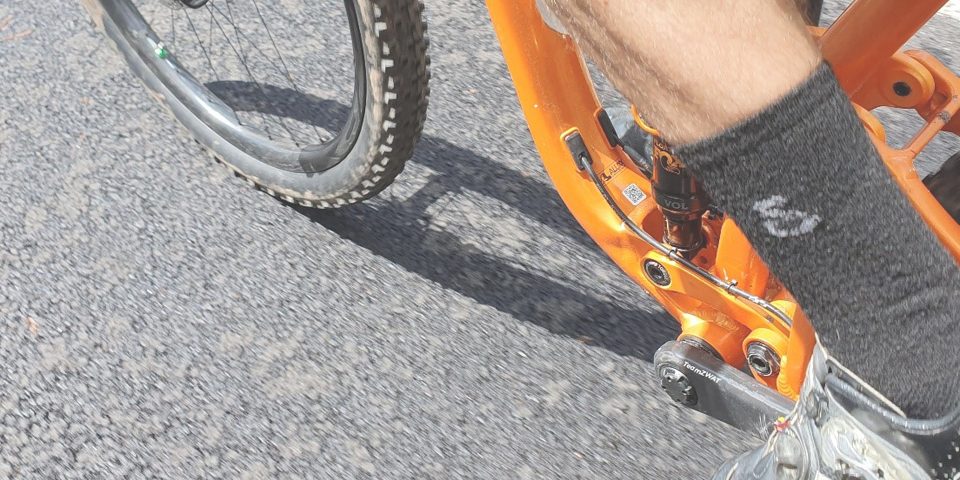
(BTW: That M7 crank is really ÿding in disguise)
It helps to know the trails
Since these are my rides, I know the specifics. Ride 1 was four laps of one single gravel climb in New Zealand, with one long descent. I rode solo and could control my intensity. On the other hand, Ride 2 was in the eastern USA, with the trails being very technical; the climb was rocky and I rode with one of my elite athletes (I was pushing it!).
If this was a file I was analyzing for one of my athletes, I’d probably ask to know more about the specifics of the ride. Afterward, we could make a smart decision of what to do with subsequent session based on the intensities we want to train at, and the available terrain.
It’s worth noting that the gravel climb on ride 1 has a few spikes too, but not a crazy amount. And actually, these spikes were on the singletrack at the very top after the gravel! I still classed this as a ride that was rather in-zone, as the spikes were not too numerous. They were also impossible to avoid.
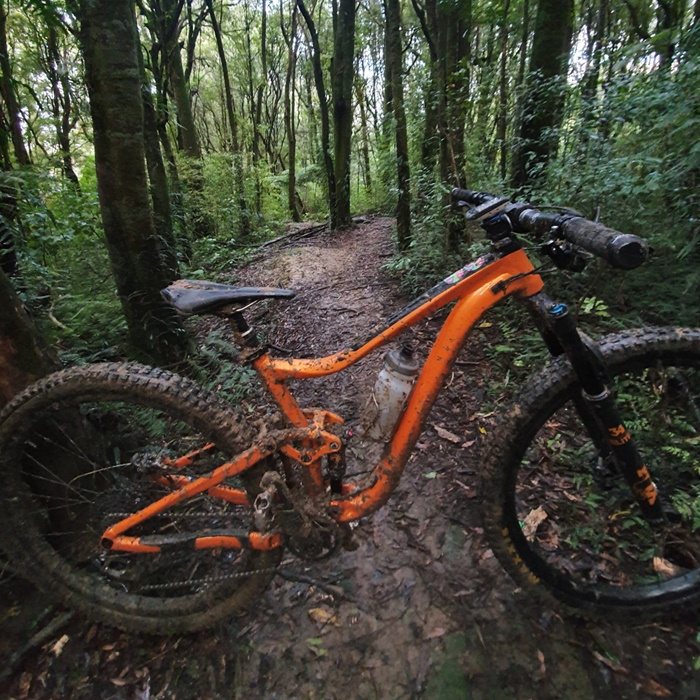
Riding up this trail would have been way too difficult due to the steepness and wet clay. It’s like riding on soap! Luckily there was a gravel road to the top…
Use your technology
Overall, it is really difficult to go easy enough on singletrack climbs. For an elite rider it is possible since they are so fit to begin with (and power is already higher), but still takes a concentrated effort to avoid putting out too much power too often. For the rest of us like me, I know that if I am climbing on singletrack I must go really slow to stay in my zone.
Done too hard and too often, it is possible to get too much of a hard training stimulus with so-called easy rides.
A good rule of thumb is that the smoother and more consistent the riding surface is, the easier it is to control intensity.
You can use your power meter in conjunction with your heart rate monitor to ensure that each and every ride is exactly what you need. Hopefully, these tips will help you make the right call.
About the author
Dr. Matt Miller is an MTB performance specialist working with athletes around the world. He has extensive experience analyzing and interpreting MTB braking and propulsive data, as well as testing products. You can follow along on Instagram or on the web.
SHARE


READ ON!
Related Articles
Guest post: Why nobody spends on MTB power meters?
During the last several weeks, I’ve been to a ton of races in North America. It’s winter now in New Zealand, so I took one of […]
Guest post: ÿding, first impressions
We have sent one ÿding power meter to our good friend Matt Miller – who is the worlds first PhD in mountain biking – to share his […]
Guest post: What power meter should I get?
Having previously worked with Matt Miller – who is the worlds first PhD in mountain biking – it seemed obvious to have him give you his […]