
FTP Study
FTP20 Study First Look
Processing Data
The data from the FTP tests is finally starting to flow in for analysis, and we are super excited to start looking deeper into the numbers. This involves a lot of filtering, data analyzations and plotting. Right now, our brains a filled with formulas and numbers, so snapping out and explaining this stuff in an easy-to-understand manner can be a bit of a challenge :)) We will try our best!
One of the goals of the study is to find something that is useful for you as riders, and not for us as nerds. We want to help you to become better on the bike. Plus we generally want to provide a good overview of everything that is going on when you pedal. So thank you for giving us the opportunity to do this by uploading your hard earned FTP20 data. (Pss. you can still join)
Here is a deeper look at the initial nerdy stuff:
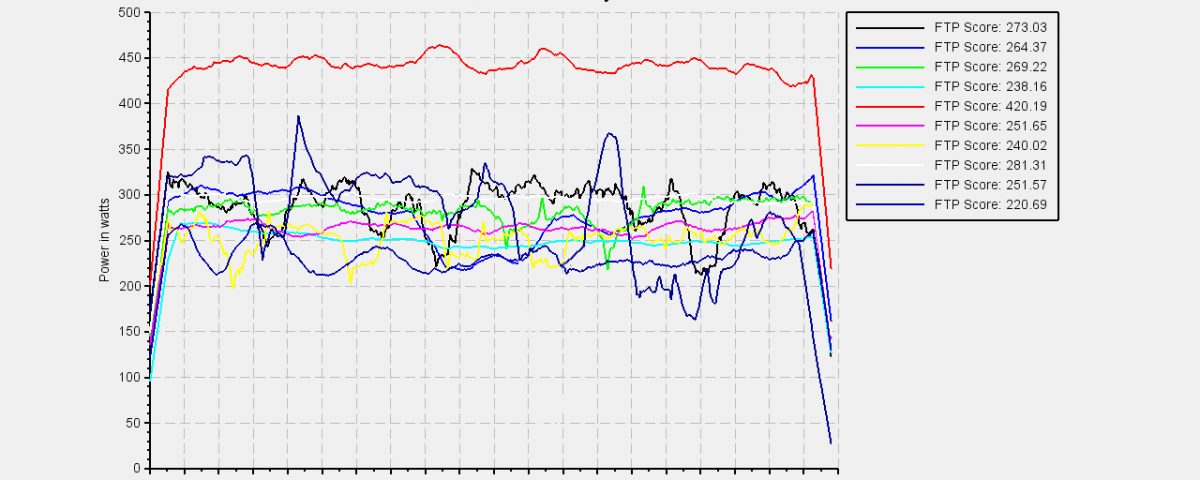
We looked at a wide range of FTP20 data contributors and picked out 9 individual riders who attend the FTP20 Study. In the range, there are riders with different levels of technique and endurance. Let’s took a look at how their FTP20 tests went:
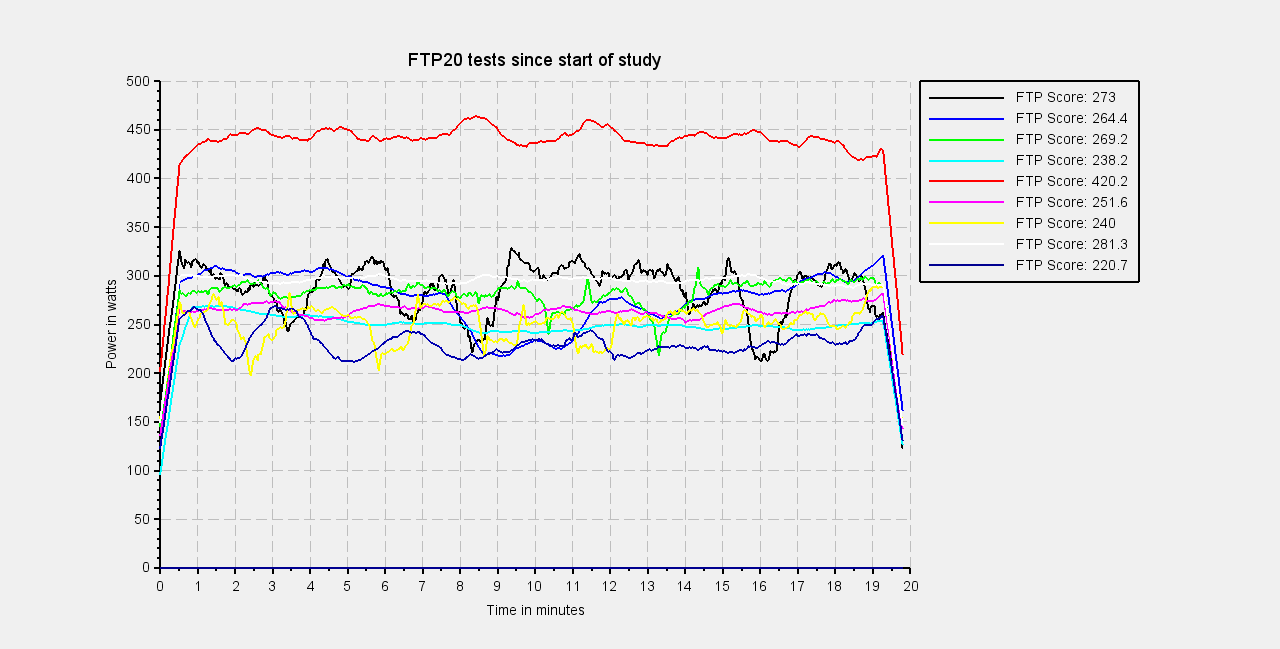
Hmm, pretty good!
Above you see a graph of the 20 minutes of suffering (or joy?). Anyway, a simple filter is being used as a moving average filter – what this basically means is that it smoothens the data out, and that’s why you see nice and (somewhat) smooth lines in the graph. ‘What is a filter?’ – you might ask. Great question. A filter is simply some formulas that are systematically being applied to the whole dataset. This can be done to make the data easier to read and compare, to synchronize the data and much more. It can also be used to make you look stronger or weaker, but we naturally try to keep it clean and be cautious about how we are treating your data – without it the graphs would simply be too messy to look as.
In this case, we used this:

(where P is the power vector, N is the number of samples in P, and i is the index. Or in other words the average of the power throughout the test minus 5%)
The moving average filter’ band spans approximately over 64 seconds, this results in much smoother graphs.
In the figure, there are a few interesting sets of power data. If we start by looking at the red graph, it shows an average power of approximately 440 Watts which is by far the highest of them all. It also shows a very stable set of power data. Impressive.
Another way to look at the FTP20 contributors’ datasets is the histogram underneath. The histogram is a normalization of the distribution of the power generated throughout the 9 contributors’ uploads.
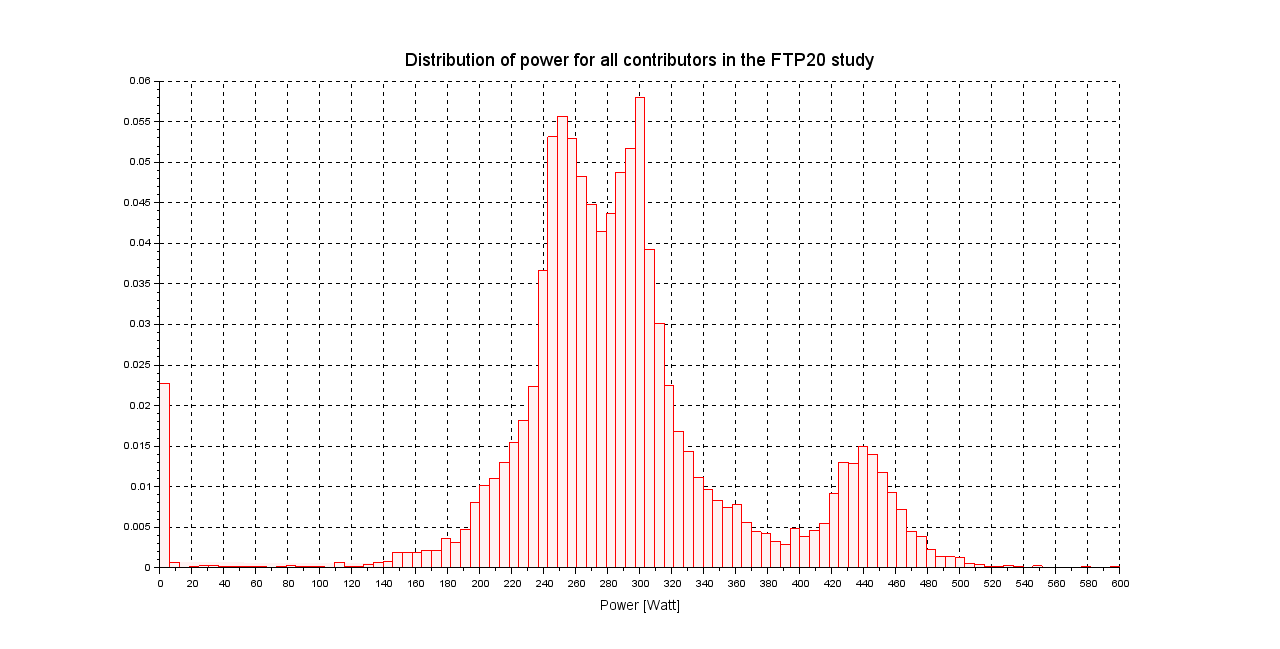
The higher the red columns are, the longer the riders spend in these power intervals. Remember that this graph is for all 9 riders.
The riders mostly spend their time in three intervals – the three peaks on the graph. The first group is 250-260 Watts, second is around 300 Watts and the third and the only one easily detected is the peak at 440 Watts (which is the red dataset from the above figure). This is a good way to help the individual rider to know how he/she generally performs as compared to the other people in the test.
All this you now have just seen (and read) is really just the very tip of the “Ice Berg”. During the upcoming weeks, we will have a lot more thing to show. The majority of the findings and details will first be available for the ones are participating in the study, but of course, all of you TeamZWATT riders see more of this in the future.
SHARE


READ ON!
Related Articles
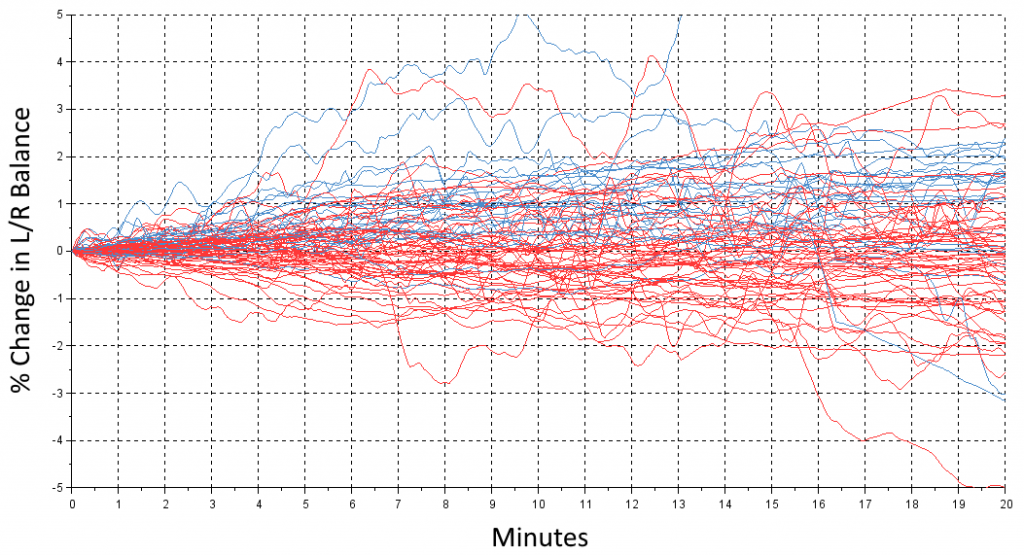
What happens when you get tired?
Today, we take a look at what happens with the left/right balance during those hard 20 minutes. You all start out at some level – we […]
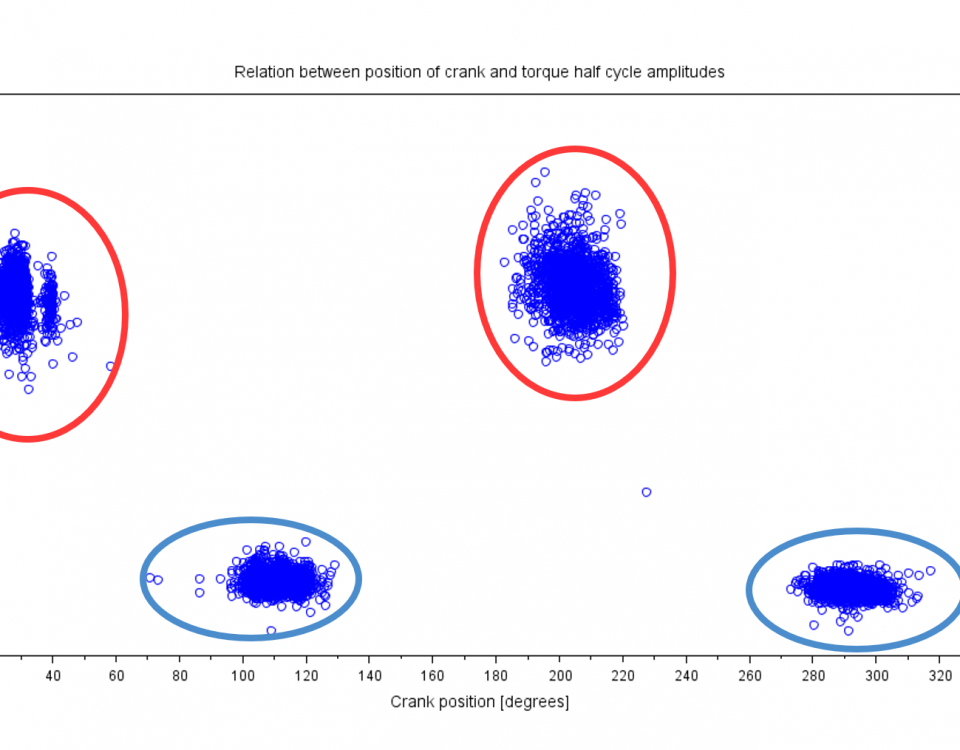
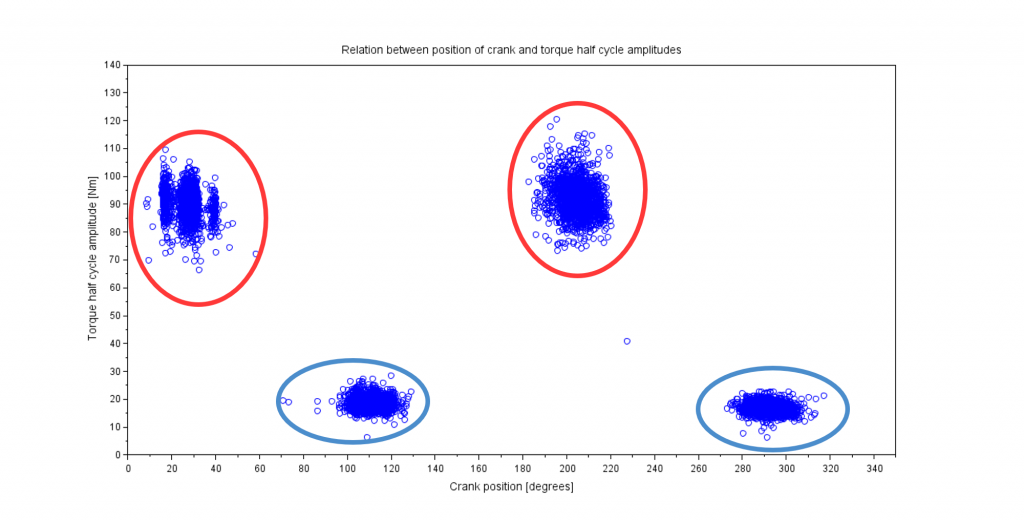
FTP20 Study Basics – Torque analysis p.2.
Understanding the torque zones and the outcome thereof. In the previous blog’s torque analysis we saw the division of the minimum and maximum torque and how they […]
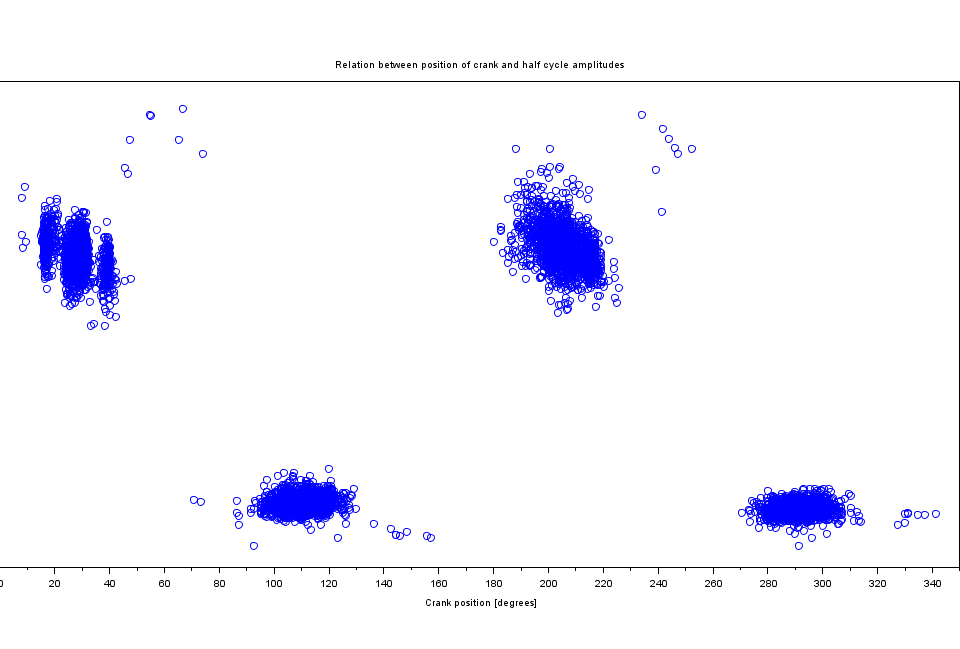
FTP20 Study Basics – Torque analysis
Understanding the detection of active zones and extremes. This time we drive further down the road of understanding of the pedalled data and show you what […]