
FTP Study
FTP20 Study Basics – Torque analysis
Understanding the detection of active zones and extremes.
This time we drive further down the road of understanding of the pedalled data and show you what torque analysis really is.
In order to identify the active torque zones we are looking for are outliers in datasets that can give us some information about the current data. Since the torque is the biggest role for fatigue (and it is instant information), it is the primary focus for getting information changes over time.
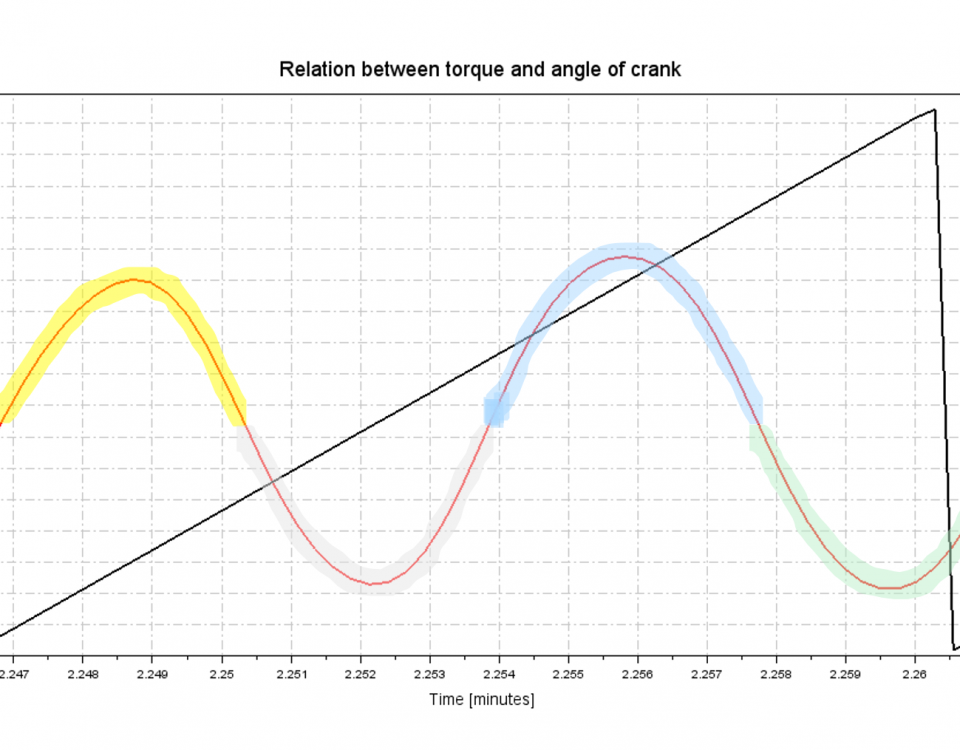
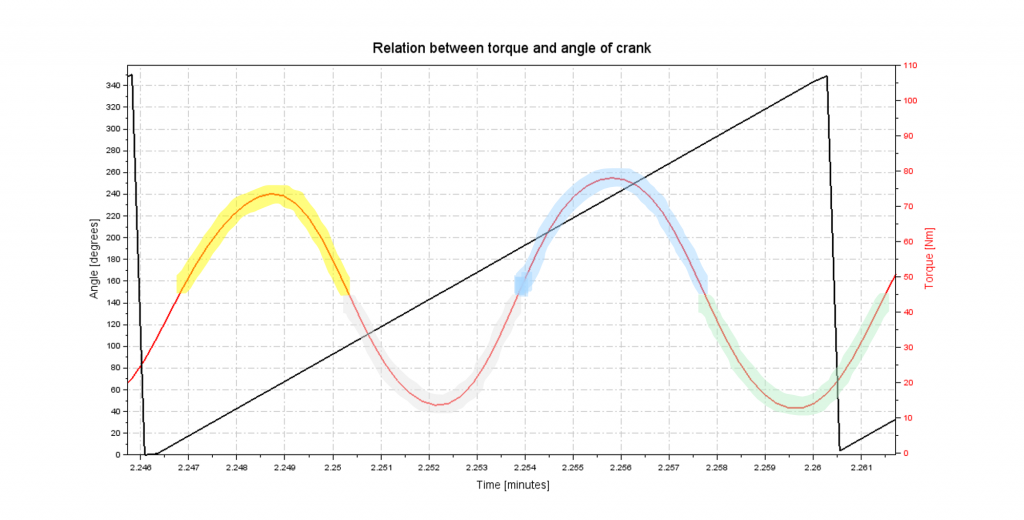
In our case, we want to look closer at the “zones” of the peanut plot where the torque peaks and where it’s at its lowest. To do that we look at the torque to angle in the figure below.
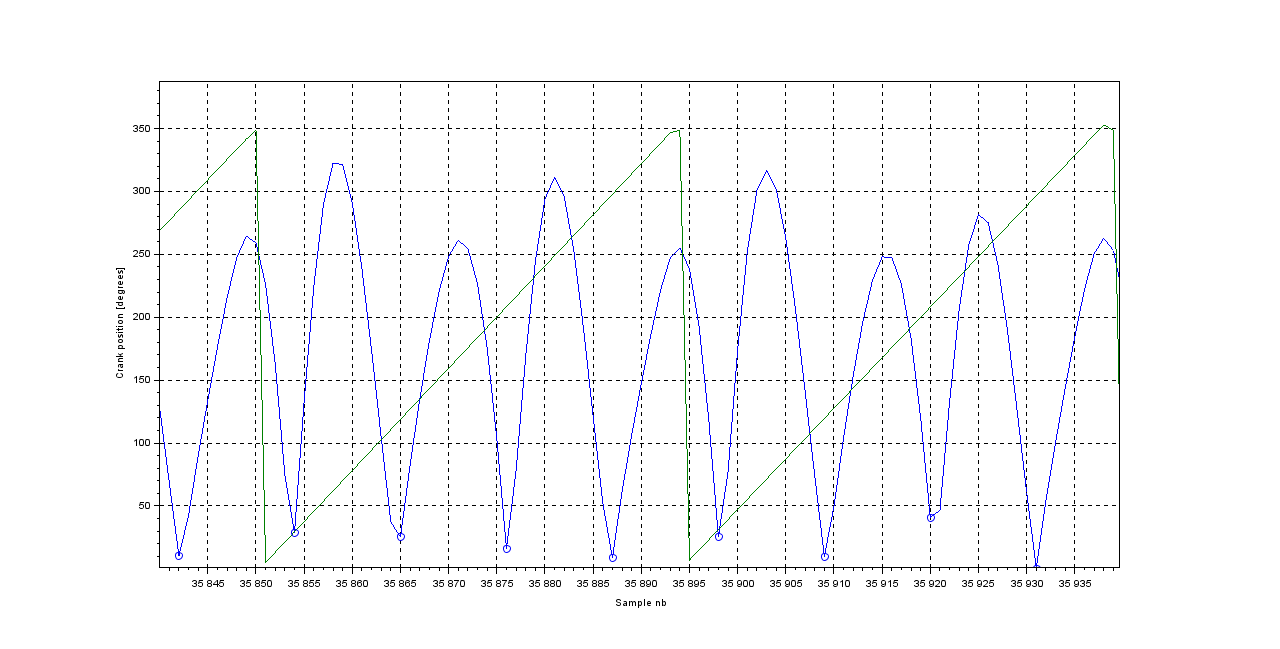
Here we see a plot of the low pass filtered absolute normalized version of the raw torque from the sensor. To improve later analysis a low pass filter is used for noise attenuation. The torque is plotted with the position of the crank in degrees. Among other functions, we use a function we call “dropDetect” which detects the transition from peak to dip in torque value. This is calculated from the dips of every half-cycle. These transitions are illustrated with small blue circles. The circles describe to which sample the transition has occurred, and can be applied to a non-absolute torque version which we can see below.
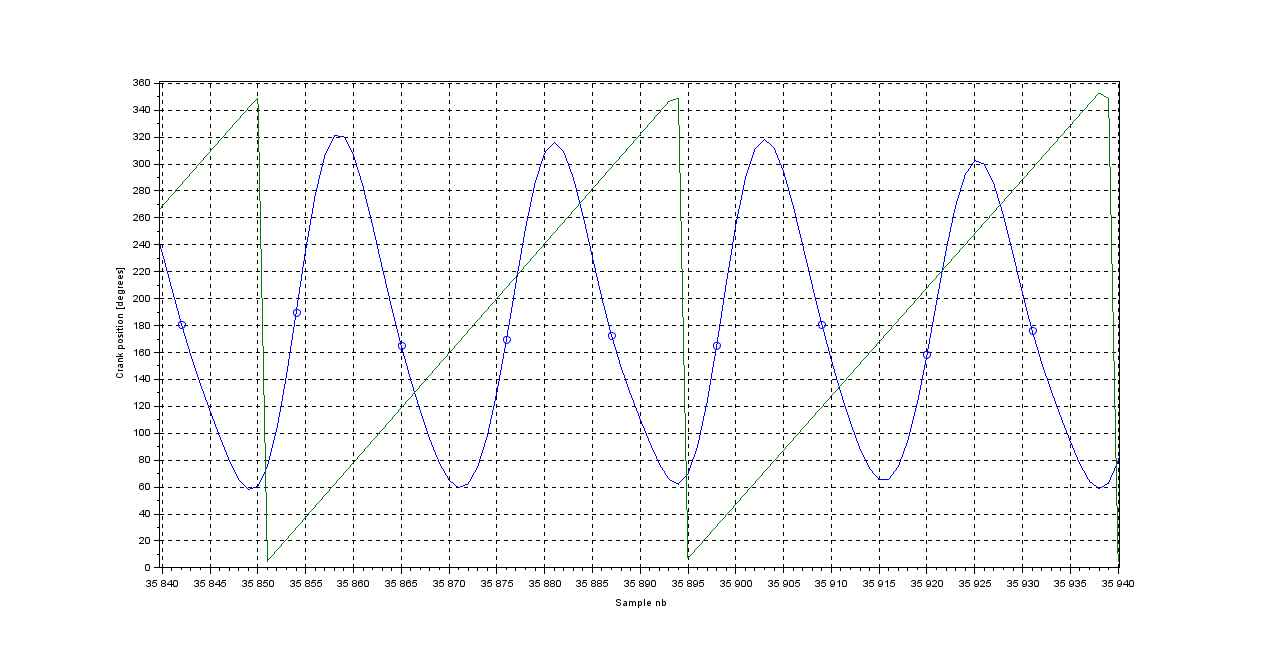
This is actually the same plot that we showed at last time, but with exact transition points for every zone in every revolution.
We are now able to detect minimum and maximum values between each of the circles, which is a description of the peak and dip in every zone of the peanut plots.
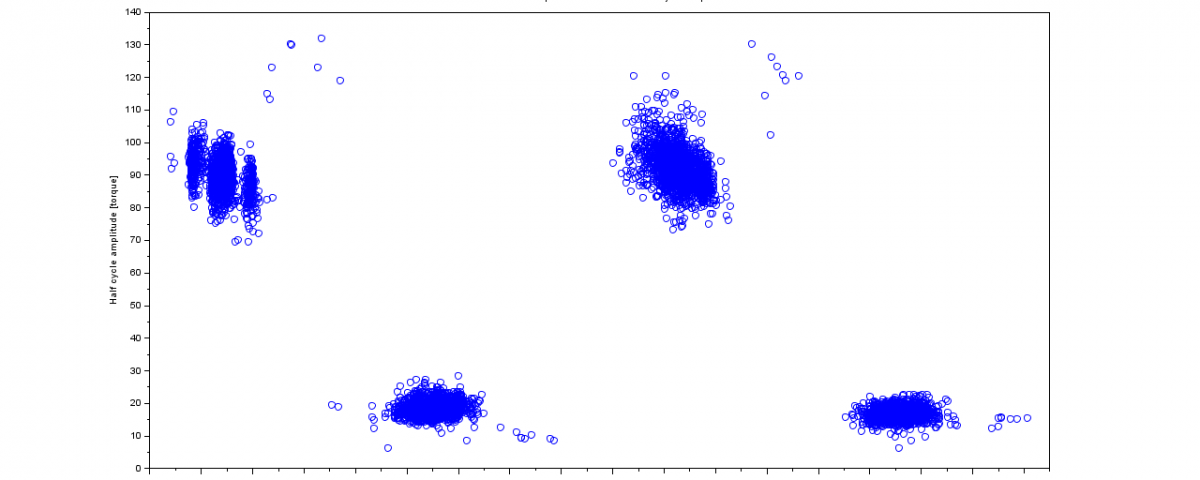
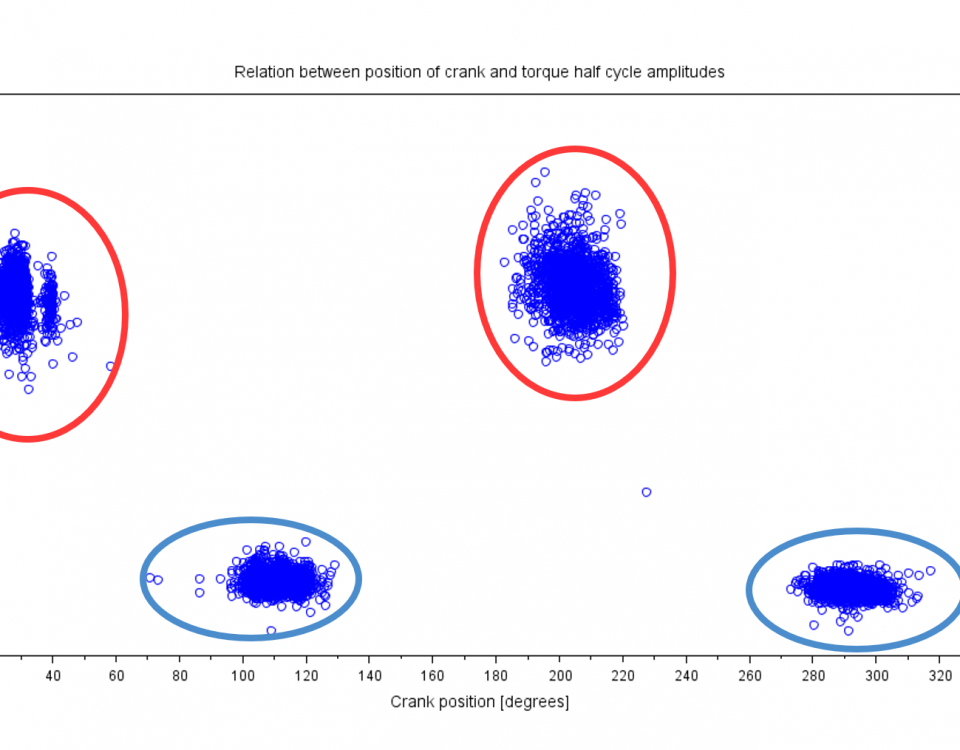
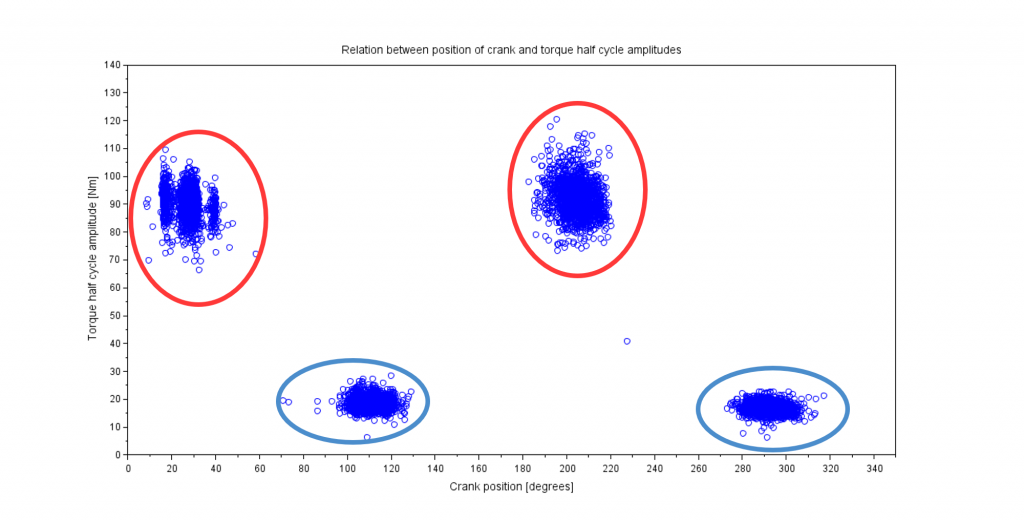
Plotting all the maximum and minimum values of this plot results in the data illustrated here. X-axis is the crank angle. Y-axis is the torque. Each point shows one torque peak or valley in the FTP test.
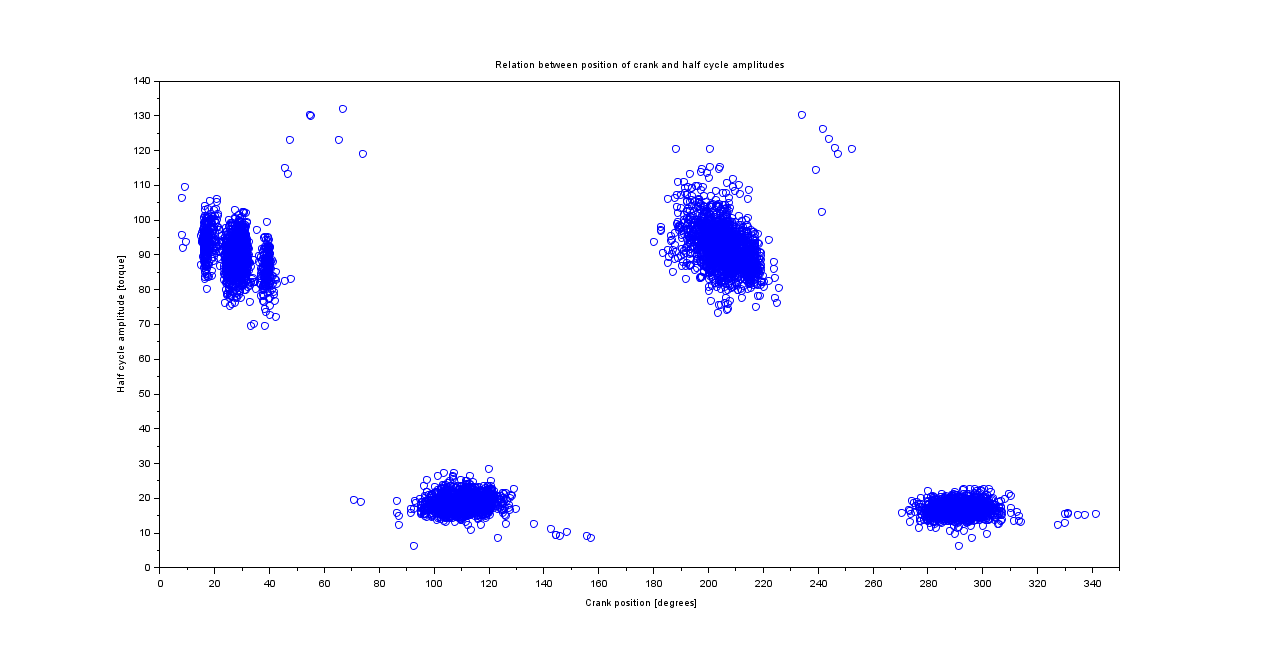
There is clearly a pattern in how the torque peaks and valleys sit for this rider. What can we learn from this?
Actually, we are not quite sure what causes the vertical lines formed by the dots in the upper left corner, so that is something interesting to investigate. Do other riders have the same effect? Is it always only one leg?
There is clearly a difference related to left/right balance, which we want to study more.
Stay tuned.
SHARE


READ ON!
Related Articles
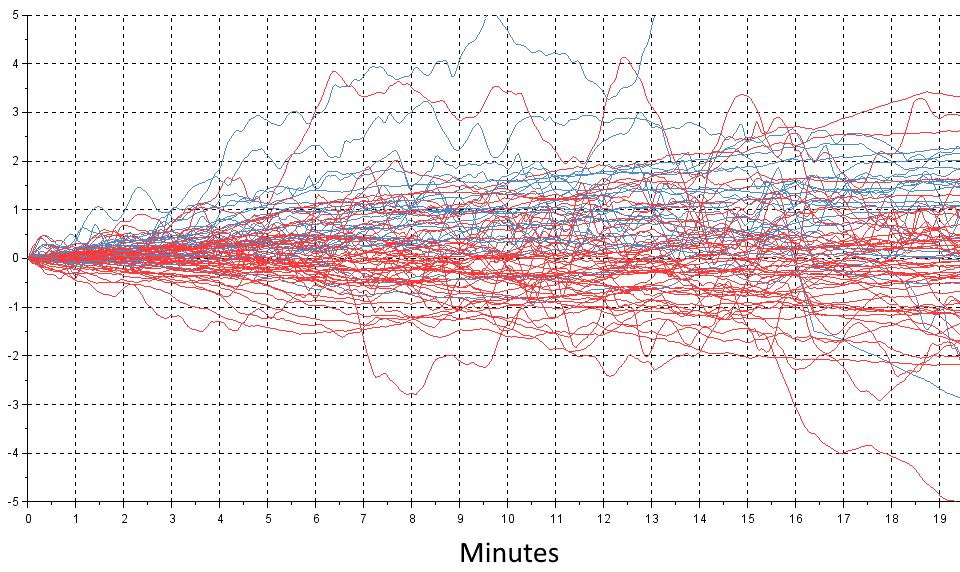
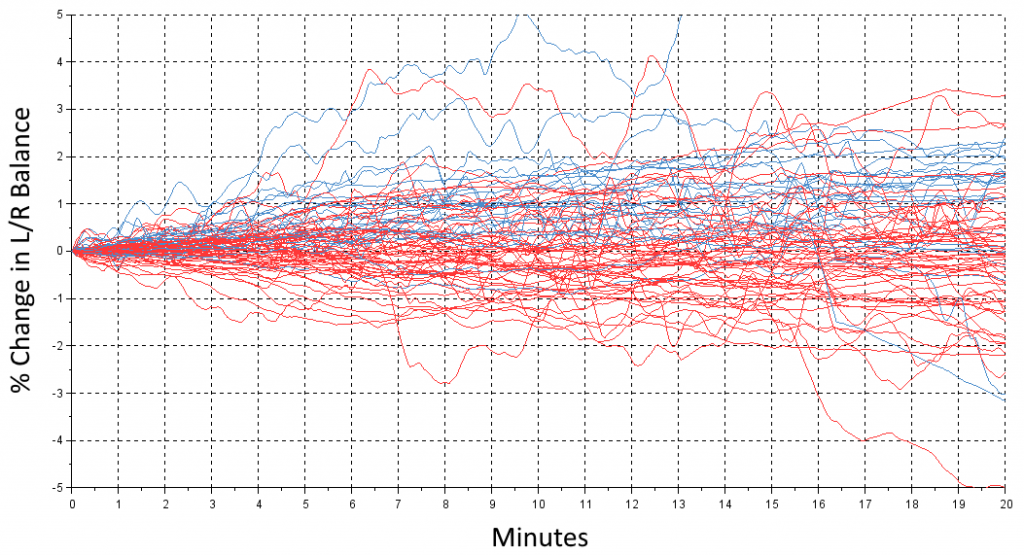
What happens when you get tired?
Today, we take a look at what happens with the left/right balance during those hard 20 minutes. You all start out at some level – we […]
FTP20 Study Basics – Torque analysis p.2.
Understanding the torque zones and the outcome thereof. In the previous blog’s torque analysis we saw the division of the minimum and maximum torque and how they […]
FTP20 Study Basics – From Torque And Angle To Peanut Plot
A few weeks ago – we dived into the cadence and power relationship in the FTP20 tests that participants have been uploading recently (Click here to read […]