
FTP Study
FTP20 Study Basics – Torque analysis p.2.
Understanding the torque zones and the outcome thereof.
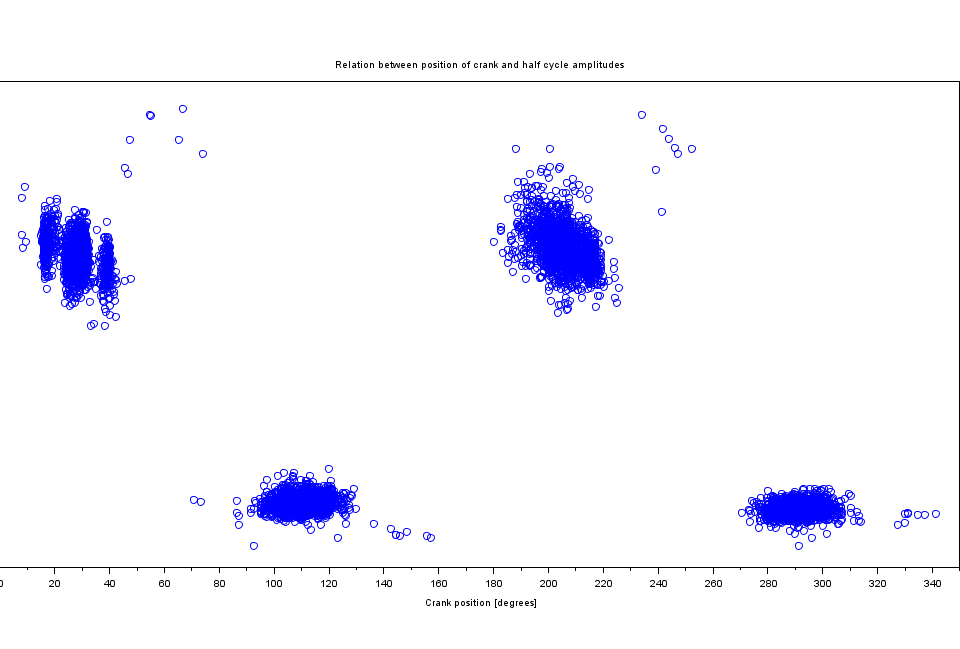
In the previous blog’s torque analysis we saw the division of the minimum and maximum torque and how they clearly locate in different zone-like arrangements.
Now, some hot stuff!
This time we look further into the segregation of the minimum and maximum torque values and how we can use the information gained from that exact plot.
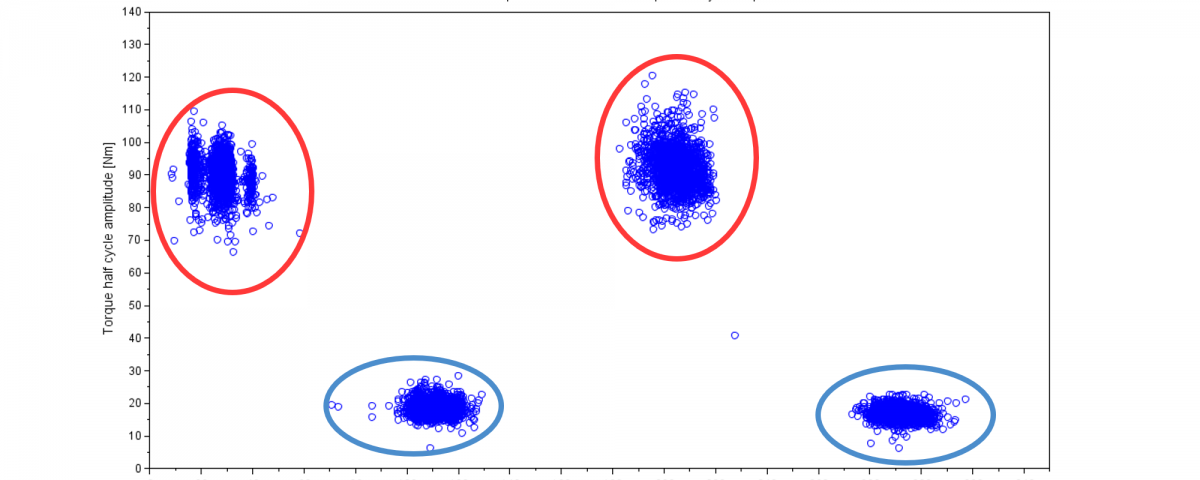
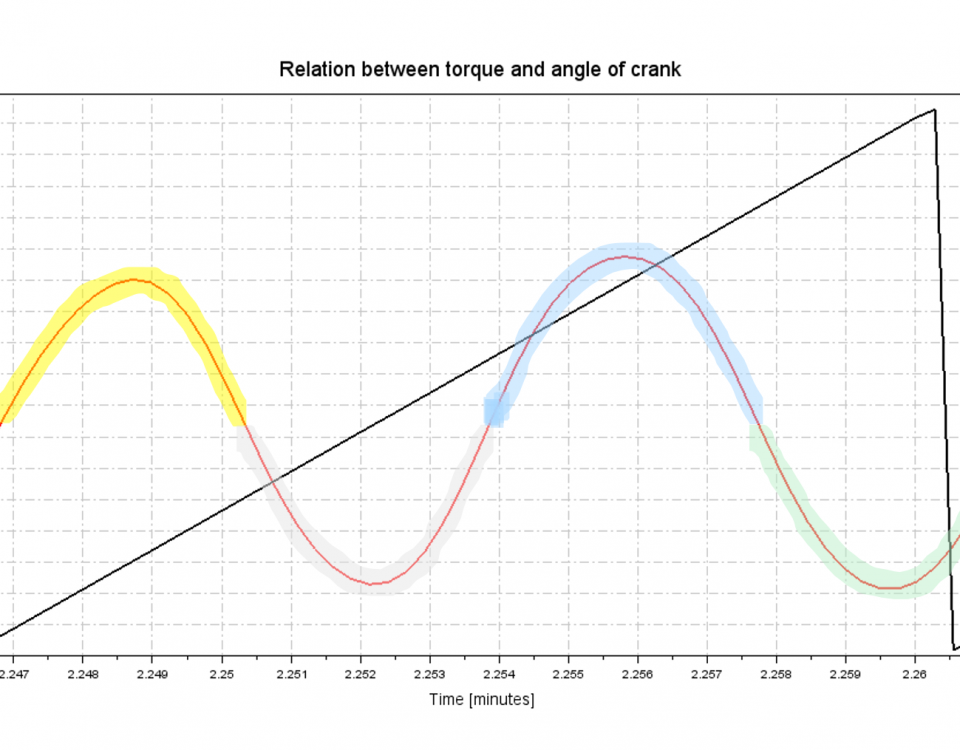
Here’s is the plot from last week but with added zones for the vertical minimums and horizontal maximums (looking at the crank in rotation).

From this, we can extract all the values that belong to each zone and take a closer look at them apart from the other zones. This can give an understanding of the development of that exact zone over time.
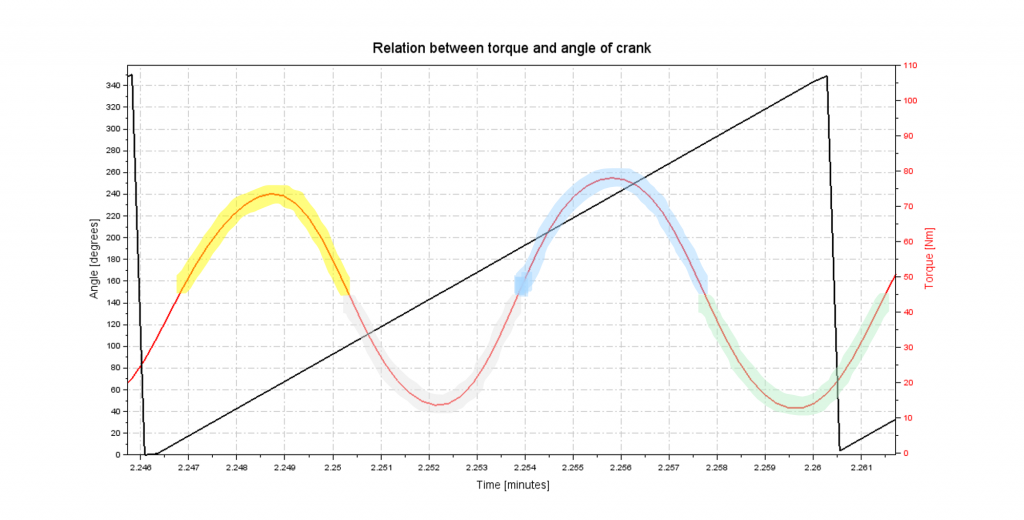
Underneath we see both of the zones from what is ultimately the maximums (red zones) and minimums (blue zones). Each of the coloured straight lines is a regression of the respective data and shows the slope of the data and how it changes over time.
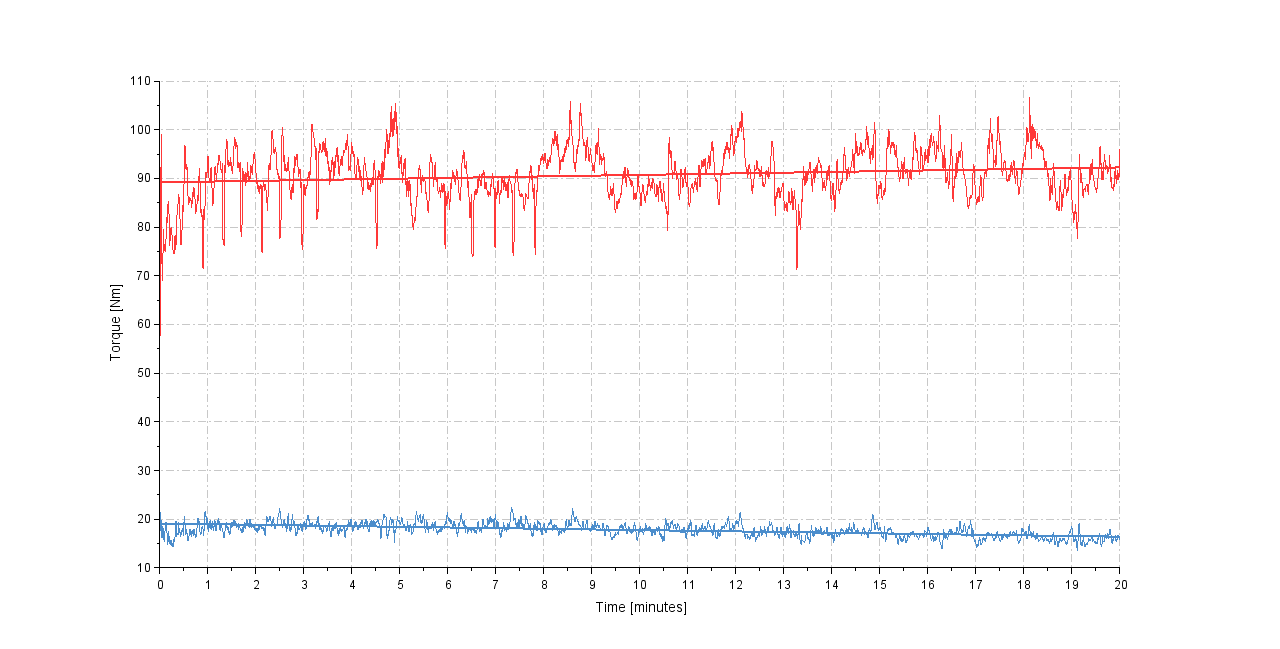
We see from this plot (blue curve) that the rider’s minimum torque values decrease during the 20 minute FTP test as the rider gets tired or unfocused distributing the power output to all working muscles. To compensate the rider ups the effort on the maximum zones (red curve) to keep a constant power output.
This shows that even though a riders power and cadence output may be looking constant and steady, there is still more information to extract. Stuff you never see on your standard head unit.
SHARE


READ ON!
Related Articles
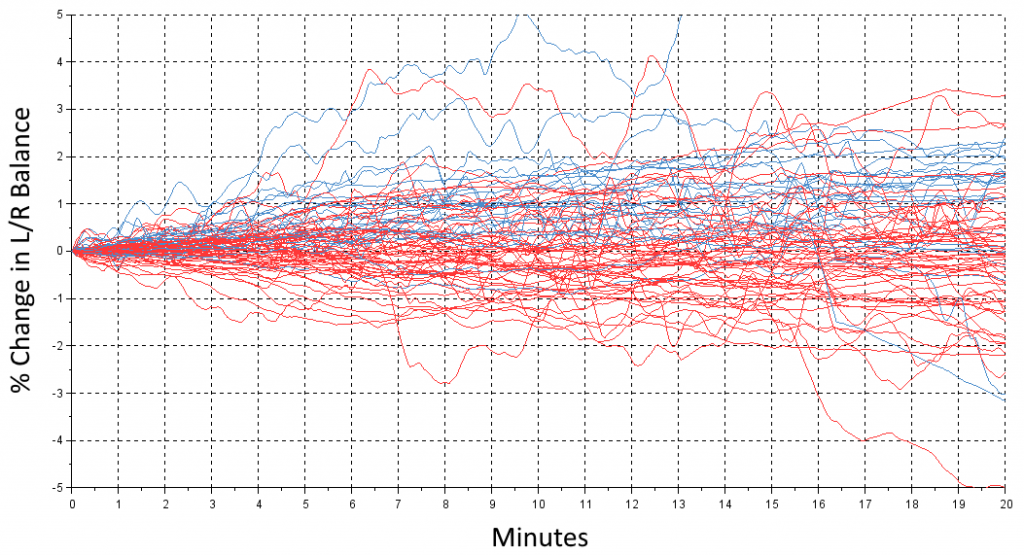
What happens when you get tired?
Today, we take a look at what happens with the left/right balance during those hard 20 minutes. You all start out at some level – we […]
FTP20 Study Basics – Torque analysis
Understanding the detection of active zones and extremes. This time we drive further down the road of understanding of the pedalled data and show you what […]
FTP20 Study Basics – From Torque And Angle To Peanut Plot
A few weeks ago – we dived into the cadence and power relationship in the FTP20 tests that participants have been uploading recently (Click here to read […]