
FTP Study
FTP20 Study Basics – Cadence & Power
Last time we introduced you to some of the more basic data filterings we’re doing for the FTP20 study. You saw all the FTP20-scores with the corresponding plot of the power over time through a moving average filter. (In case you missed click here to read).
This time we took a preliminary look to the relation of power and cadence throughout an FTP20 test. But before going into that, here is a little background to cadence and to the idea.
Cadence is the number of pedal revolutions per minute (RPM).
What is the ideal cadence for you? It’s one of those things in cycling that everyone has an opinion about – just ask someone from your local cycling club. Most people will tell you, that you should generally aim for a high cadence – the higher the better! But a lot of that is based on some misleading and inconclusive research on the matter.
When you pedal faster, the saying goes, you put less strain on your muscles with each pedal stroke. Sounds good, right? But, others suggest that if you pedal too fast (riding with a very high cadence in a low gear), you waste a lot of energy on moving your body, instead of your bike.
The relationship between the “ideal” cadence and optimal power output is one of those things, that we are looking into for our FTP study.
We’ve seen some incredibly high and steady power outputs in both lower and higher cadences, and we absolutely love to dig into the data. Keep it coming!
And here is the fun part.
We’ve picked out 10 interesting data sets from the FTP20 data contributors. Some of them are the same as last weeks and some are new. We didn’t use all the data as it would be too messy and hard to distinguish them from each other.
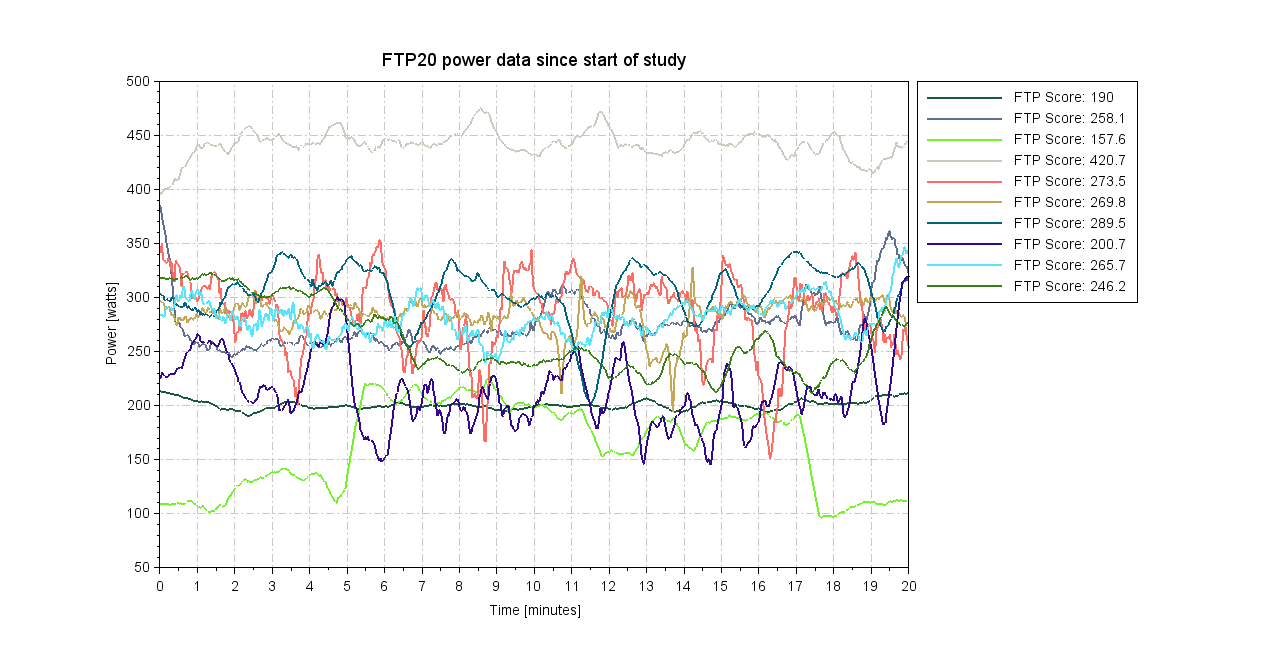
The first plot is the general FTP20 power plot just like what you have seen the last time.
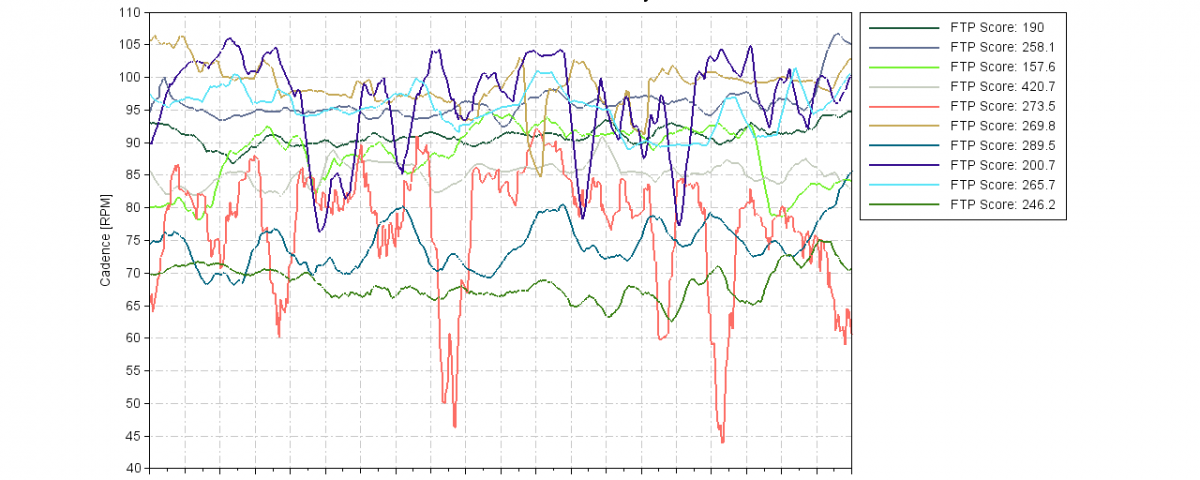
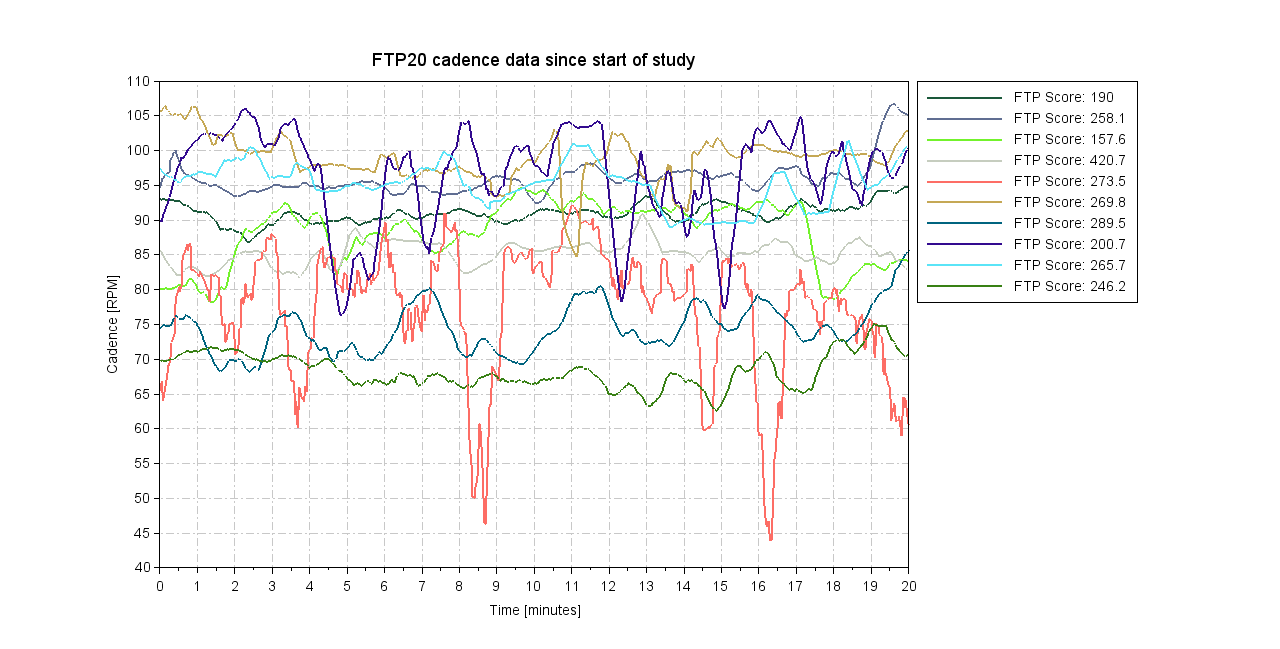
The second plot below shows the corresponding cadence to the same sets of data. As you can see at the legend box on the right side of the figure, the colours of the graphs are corresponding to the colours of the graphs with the same FTP20-score from the plot of power.
The idea this time was to see if there were any distinguishable artefacts to the power/cadence relationship and whether a high cadence necessarily is the best cadence.
It’s hard to tell. These datasets consist of 10 different riders and not the same person that drove an FTP20-test at several different cadences and that is no surprise.
The important thing here is that you can do a consistent FTP20-ride without getting too exhausted halfway or having a lot of energy left at the end. So just because the grey (4th from the top in the legend box) graph did 420 in FTP-score has a cadence at approximately 83, doesn’t mean that that is the optimal cadence for everyone else.
Verdict – so far
What is optimal cadence for an FTP20 test? “Yes”
Generally, the cadence (RPM) falls between 80 and 100 for most riders – just see the above in the cadence graph. But it’s also quite clear that higher cadence will not necessarily mean a lower FTP score alone. Just see the “Sand Brown” one above. Unfortunately, you cannot put your optimum side by side to another rider’s. It simply depends on too many factors like experience, training level, set up, features of your body etc. To determine your optimal cadence for maximum power output (without fluctuations) you need to perform multiple FTP test. That’s what will help you to find your optimum.
SHARE


READ ON!
Related Articles
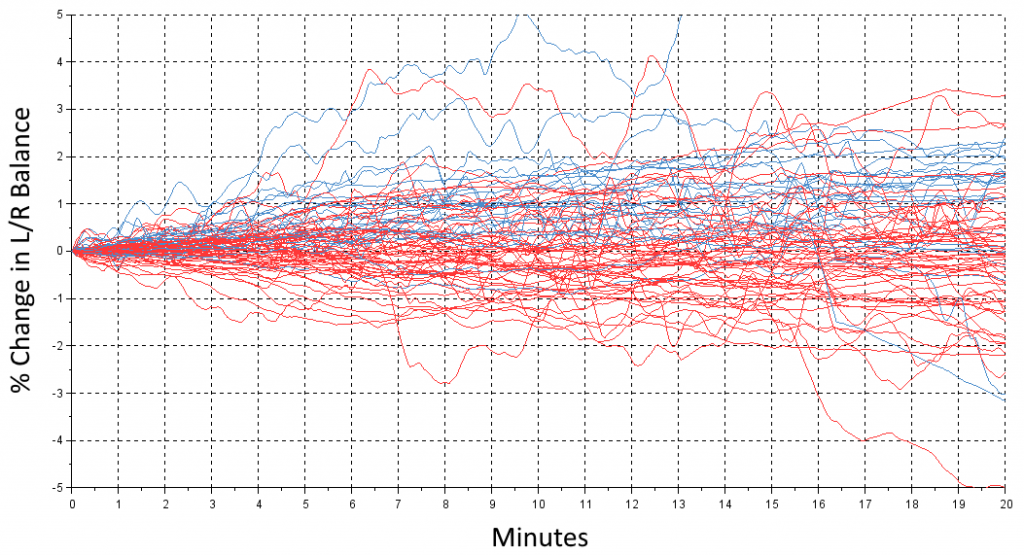
What happens when you get tired?
Today, we take a look at what happens with the left/right balance during those hard 20 minutes. You all start out at some level – we […]
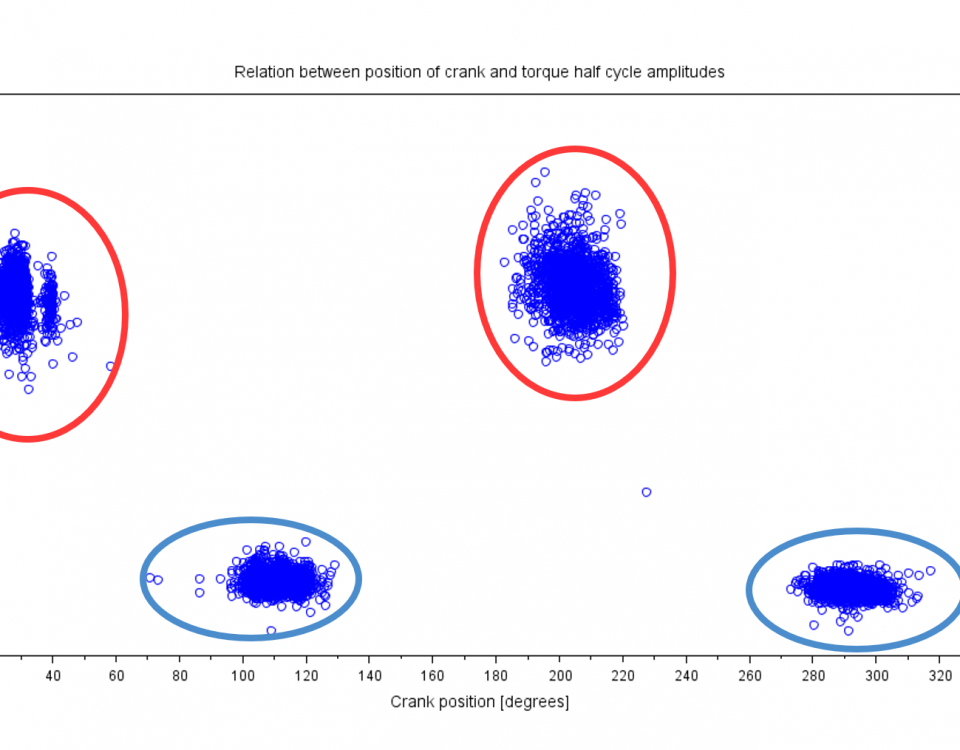
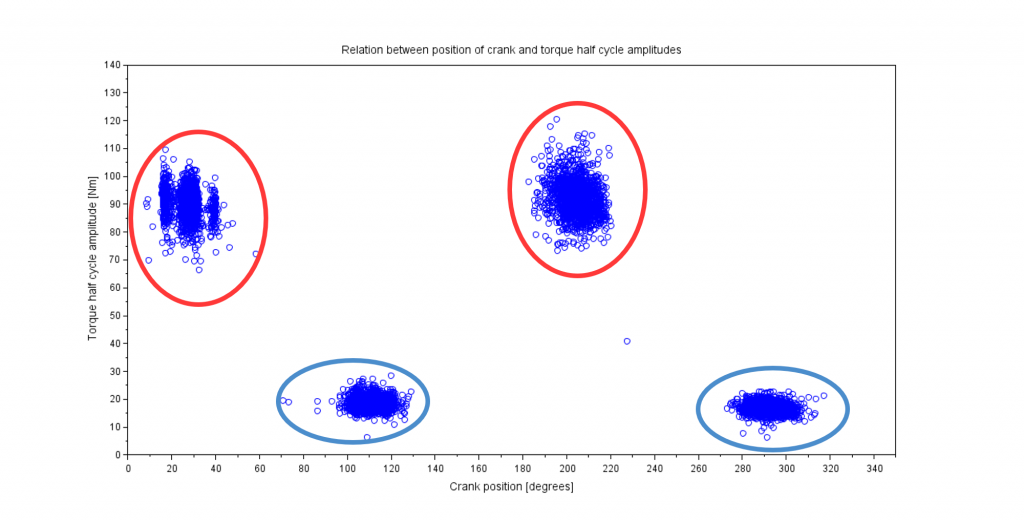
FTP20 Study Basics – Torque analysis p.2.
Understanding the torque zones and the outcome thereof. In the previous blog’s torque analysis we saw the division of the minimum and maximum torque and how they […]
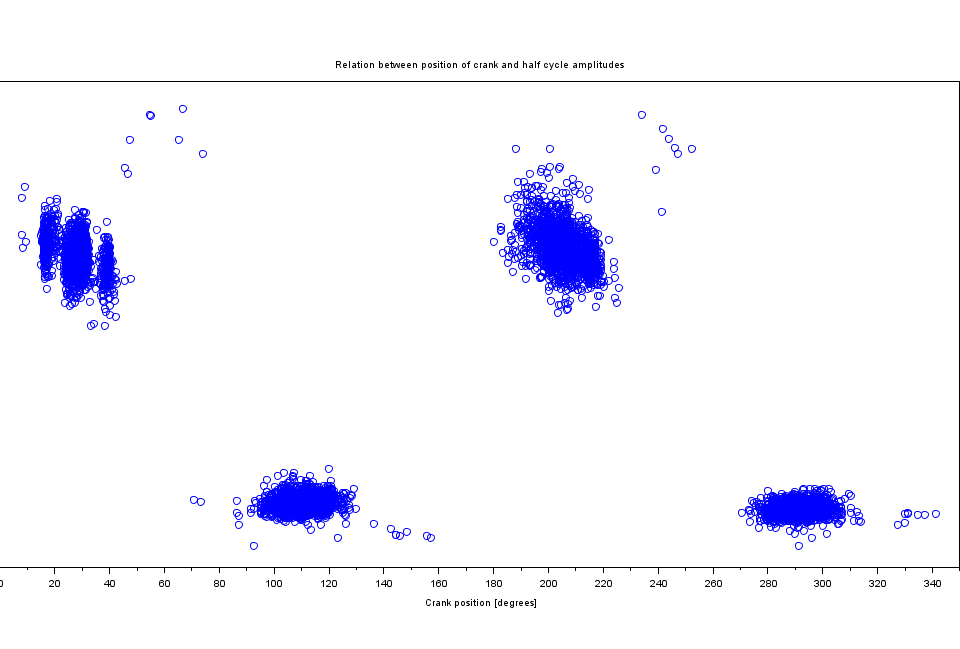
FTP20 Study Basics – Torque analysis
Understanding the detection of active zones and extremes. This time we drive further down the road of understanding of the pedalled data and show you what […]